prometheus监控之黑盒(blackbox)监控
本文最后更新于 2024-07-22,
若内容或图片失效,请留言反馈。部分素材来自网络,若不小心影响到您的利益, 请联系我 删除。
本站只有Telegram群组为唯一交流群组, 点击加入
文章内容有误?申请成为本站文章修订者或作者? 向站长提出申请
原文:https://www.cnblogs.com/yangmeichong/p/18156586
黑盒监控
"白盒监控"--需要把对应的Exporter程序安装到被监控的目标主机上,从而实现对主机各种资源及其状态的数据采集工作。
但是由于某些情况下操作技术或其他原因,不是所有的Exporter都能部署到被监控的主机环境中,最典型的例子是监控全国网络质量的稳定性,通常的方法是使用ping操作,对选取的节点进行ICMP测试,此时不可能在他人应用环境中部署相关的Exporter程序。针对这样的应用的场景,Prometheus社区提供了黑盒解决方案,Blackbox Exporter无须安装在被监控的目标环境中,用户只需要将其安装在与Prometheus和被监控目标互通的环境中,通过HTTP、HTTPS、DNS、TCP、ICMP等方式对网络进行探测监控,还可以探测SSL证书过期时间。
blackbox_exporter:
- Prometheus 官方提供的 exporter 之一,可以提供 http、dns、tcp、icmp 的监控数据采集
安装方法
二进制安装(二选一)
https://prometheus.io/download/#blackbox_exporter
wget https://github.com/prometheus/blackbox_exporter/releases/download/v0.23.0/blackbox_exporter-0.23.0.linux-amd64.tar.gz

tar zxvf blackbox_exporter-0.23.0.linux-amd64.tar.gz
mkdir /opt/prometheus -p
mv blackbox_exporter-0.23.0.linux-amd64 /opt/prometheus/blackbox_exporter

# 创建用户
useradd -M -s /usr/sbin/nologin prometheus
# 修改文件夹权限
chown prometheus:prometheus -R /opt/prometheus

# 创建systemd服务
cat <<"EOF" >/etc/systemd/system/blackbox_exporter.service
[Unit]
Description=blackbox_exporter
After=network.target

[Service]
Type=simple
User=prometheus
Group=prometheus
ExecStart=/opt/prometheus/blackbox_exporter/blackbox_exporter \
          --config.file "/opt/prometheus/blackbox_exporter/blackbox.yml" \
          --web.listen-address ":9115"
Restart=on-failure

[Install]
WantedBy=multi-user.target
EOF

# 启动
systemctl daemon-reload
systemctl start blackbox_exporter
systemctl enable blackbox_exporter
docker安装(二选一)
创建配置文件,config.yml中监控方式用不到的可以删除,例如pop3、ssh之类
mkdir /data/blackbox_exporter/

cat >/data/blackbox_exporter/config.yml<<"EOF"
modules:
  http_2xx:
    prober: http
    http:
      method: GET
  http_post_2xx:
    prober: http
    http:
      method: POST
  tcp_connect:
    prober: tcp
  pop3s_banner:
    prober: tcp
    tcp:
      query_response:
      - expect: "^+OK"
      tls: true
      tls_config:
        insecure_skip_verify: false
  grpc:
    prober: grpc
    grpc:
      tls: true
      preferred_ip_protocol: "ip4"
  grpc_plain:
    prober: grpc
    grpc:
      tls: false
      service: "service1"
  ssh_banner:
    prober: tcp
    tcp:
      query_response:
      - expect: "^SSH-2.0-"
      - send: "SSH-2.0-blackbox-ssh-check"
  irc_banner:
    prober: tcp
    tcp:
      query_response:
      - send: "NICK prober"
      - send: "USER prober prober prober :prober"
      - expect: "PING :([^ ]+)"
        send: "PONG ${1}"
      - expect: "^:[^ ]+ 001"
  icmp:
    prober: icmp
  icmp_ttl5:
    prober: icmp
    timeout: 5s
    icmp:
      ttl: 5
EOF
删除不需要的可以留下
cat config.yml
modules:
  http_2xx:
    prober: http
    http:
      method: GET
  http_post_2xx:
    prober: http
    http:
      method: POST
  tcp_connect:
    prober: tcp
  icmp:
    prober: icmp
cf代理状态码非200
  http_2xx:
    prober: http
    timeout: 5s
    http:
      method: GET
      preferred_ip_protocol: "ip4"
注意:使用preferred_ip_protocol: "ip4" 可以检测cf代理目标在 cloudflare 后面,状态码非200
docker直接运行
sudo docker run -d --restart=always --name blackbox-exporter -p 9115:9115 -v /data/blackbox_exporter:/etc/blackbox_exporter prom/blackbox-exporter:v0.19.0 --config.file=/etc/blackbox_exporter/config.yml
docker-compose运行
cd /data/blackbox_exporter/

cat >docker-compose.yaml <<"EOF"
version: '3.3'
services:
  blackbox_exporter:
    image: prom/blackbox-exporter
    container_name: blackbox_exporter
    restart: always
    volumes:
    - /data/blackbox_exporter:/etc/blackbox_exporter
    ports:
    - 9115:9115
EOF
启动:docker-compose up -d
查看状态:http://192.168.10.100:9115/
Prometheus配置
配置prometheus去采集(拉取)blackbox_exporter的监控样本数据
cd /data/docker-prometheus

cat >> prometheus/prometheus.yml <<"EOF"

#http配置
  - job_name: "blackbox_http"
    metrics_path: /probe
    params:
      module: [http_2xx]
    static_configs:
      - targets:
        - https://www.baidu.com
        - https://www.jd.com
    relabel_configs:
      - source_labels: [__address__]
        target_label: __param_target
      - source_labels: [__param_target]
        target_label: instance
      - target_label: __address__
        replacement: 192.168.10.100:9115

#tcp检查配置
  - job_name: "blackbox_tcp"
    metrics_path: /probe
    params:
      module: [tcp_connect]
    static_configs:
      - targets:
        - 192.168.10.14:22
        - 192.168.10.14:9090
    relabel_configs:
      - source_labels: [__address__]
        target_label: __param_target
      - source_labels: [__param_target]
        target_label: instance
      - target_label: __address__
        replacement: 192.168.10.100:9115

#icmp检查配置 ping
  - job_name: "blackbox_icmp"
    metrics_path: /probe
    params:
      module: [icmp]
    static_configs:
      - targets:
        - 192.168.10.14
        - 192.168.10.100
    relabel_configs:
      - source_labels: [__address__]
        target_label: __param_target
      - source_labels: [__param_target]
        target_label: instance
      - target_label: __address__
        replacement: 192.168.10.100:9115
EOF
重新加载配置:curl -X POST http://localhost:9090/-/reload
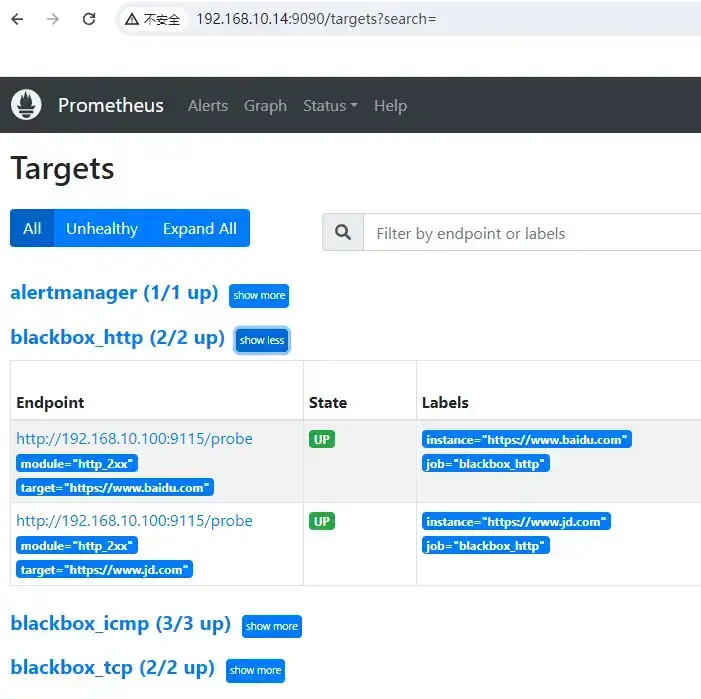
检查:
http://192.168.10.14:9090/targets?search=
监控项
probe_


probe_success                   # 是否探测成功(取值 1、0 分别表示成功、失败)
probe_duration_seconds          # 探测的耗时

# 关于 DNS
probe_dns_lookup_time_seconds   # DNS 解析的耗时
probe_ip_protocol               # IP 协议,取值为 4、6
probe_ip_addr_hash              # IP 地址的哈希值,用于判断 IP 是否变化

# 关于 HTTP
probe_http_status_code          # HTTP 响应的状态码。如果发生重定向,则取决于最后一次响应
probe_http_content_length       # HTTP 响应的 body 长度,单位 bytes
probe_http_version              # HTTP 响应的协议版本,比如 1.1
probe_http_ssl                  # HTTP 响应是否采用 SSL ,取值为 1、0
probe_ssl_earliest_cert_expiry  # SSL 证书的过期时间,为 Unix 时间戳
触发器配置
添加blackbox_exporter触发器告警规则
cat >> prometheus/rules/blackbox_exporter.yml <<"EOF"
groups:
- name: Blackbox
  rules:
  - alert: 黑盒子探测失败告警
    expr: probe_success == 0
    for: 1m
    labels:
      severity: critical
    annotations:
      summary: "黑盒子探测失败{{ $labels.instance }}"
      description: "黑盒子检测失败,当前值:{{ $value }}"
  - alert: 请求慢告警
    expr: avg_over_time(probe_duration_seconds[1m]) > 1
    for: 1m
    labels:
      severity: warning
    annotations:
      summary: "请求慢{{ $labels.instance }}"
      description: "请求时间超过1秒,值为:{{ $value }}"
  - alert: http状态码检测失败
    expr: probe_http_status_code <= 199 OR probe_http_status_code >= 400
    for: 1m
    labels:
      severity: critical
    annotations:
      summary: "http状态码检测失败{{ $labels.instance }}"
      description: "HTTP状态码非 200-399,当前状态码为:{{ $value }}"
  - alert: ssl证书即将到期
    expr: probe_ssl_earliest_cert_expiry - time() < 86400 * 30
    for: 1m
    labels:
      severity: warning
    annotations:
      summary: "证书即将到期{{ $labels.instance }}"
      description: "SSL 证书在 30 天后到期,值:{{ $value }}"

  - alert: ssl证书即将到期
    expr: probe_ssl_earliest_cert_expiry - time() < 86400 * 3
    for: 1m
    labels:
      severity: critical
    annotations:
      summary: "证书即将到期{{ $labels.instance }}"
      description: "SSL 证书在 3 天后到期,值:{{ $value }}"

  - alert: ssl证书已过期
    expr: probe_ssl_earliest_cert_expiry - time() <= 0
    for: 1m
    labels:
      severity: critical
    annotations:
      summary: "证书已过期{{ $labels.instance }}"
      description: "SSL 证书已经过期,请确认是否在使用"
EOF
检查配置并加载:
docker exec -it prometheus promtool check config /etc/prometheus/prometheus.yml

curl -X POST http://localhost:9090/-/reload
http://192.168.10.14:9090/rules
http://192.168.10.14:9090/alerts?search=
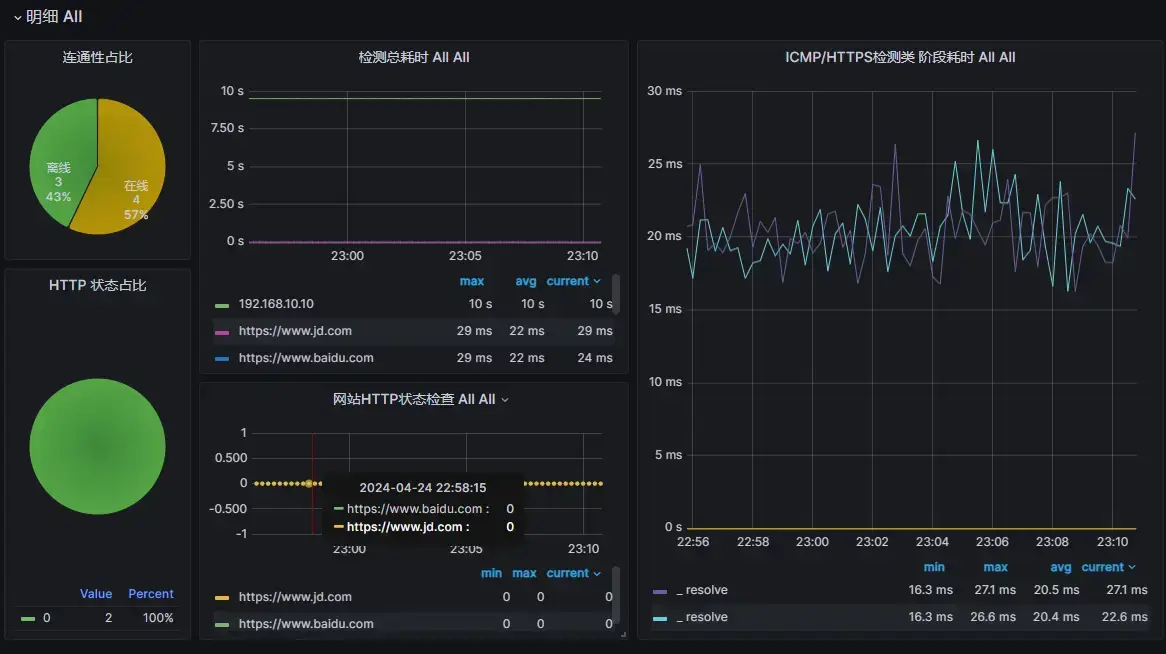
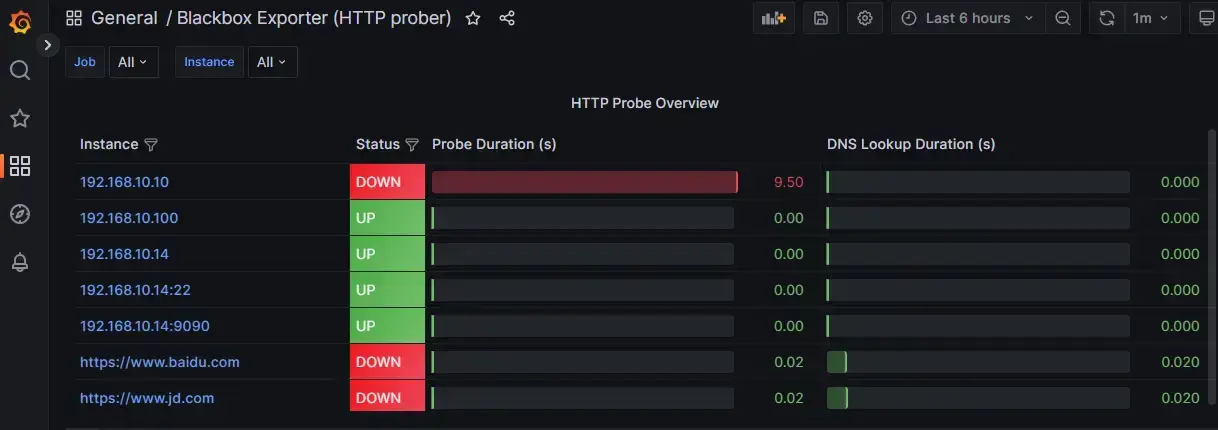
grafana dashboard图形化展示
https://grafana.com/grafana/dashboards/13659-blackbox-exporter-http-prober/
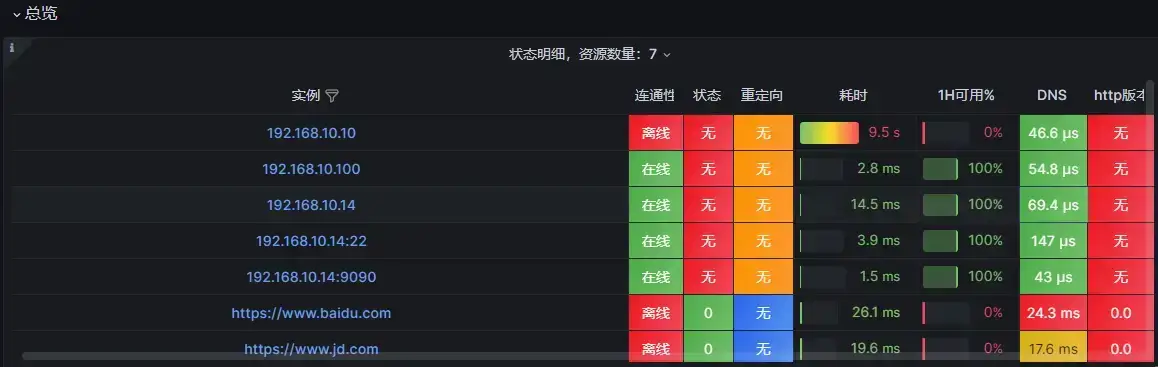
检测总耗时 和 HTTP状态占比 这2个图形,显示异常
检测总耗时这个图行点编辑---找到 Options把Legend里面的值从 {{env}}_{{name}}修改为 <{{instance}}